

Stage 03 · Plan · OptiPlan FP&A
Let your P&L talk.
OptiPlan is driver-based FP&A software that ties every P&L line to the operational drivers that move it, for budget, forecast and variance.
Gross margin31.4%−3.1 pts
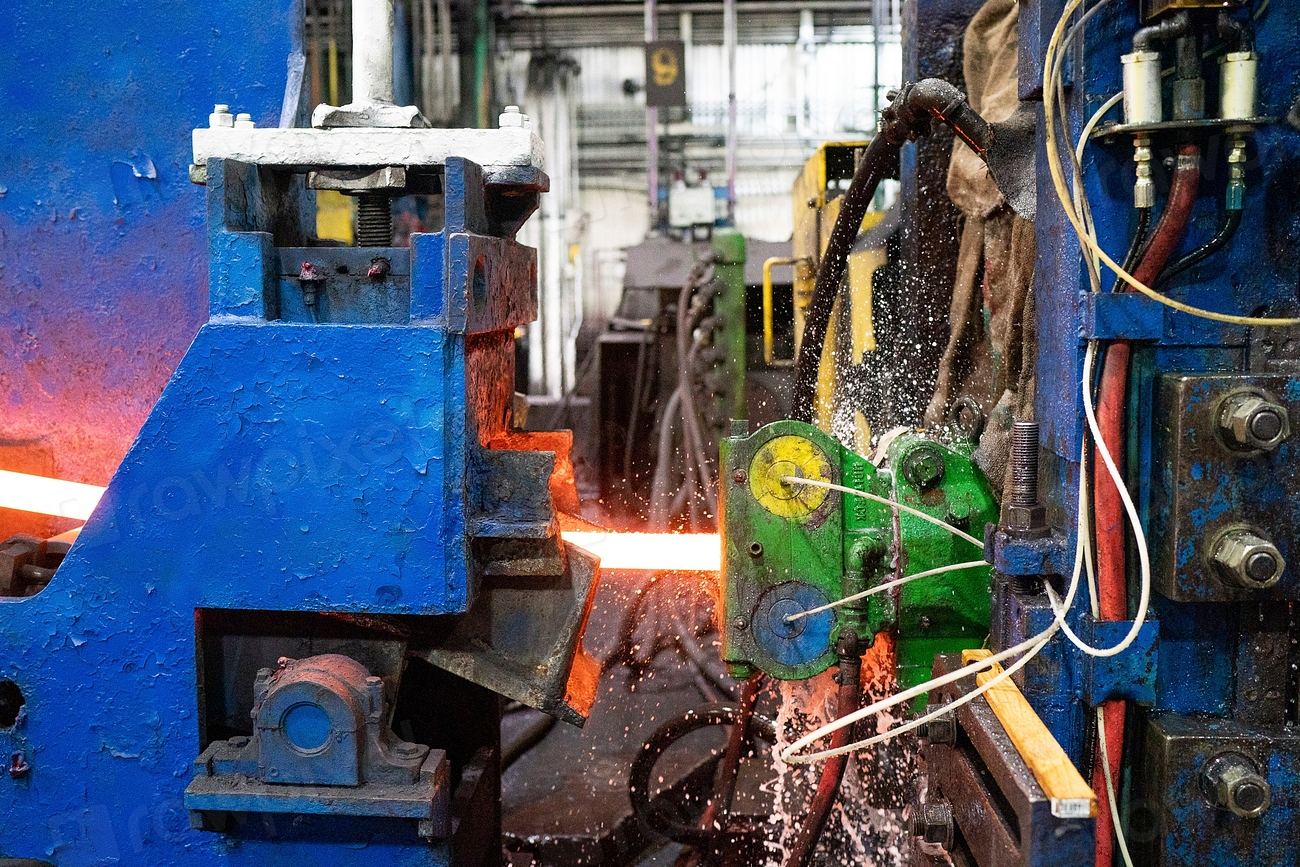
Plant
Yield
91.3%−6.2 pts

Field
Lifting cost
$/bblper well
Branch
Spread
bpby product
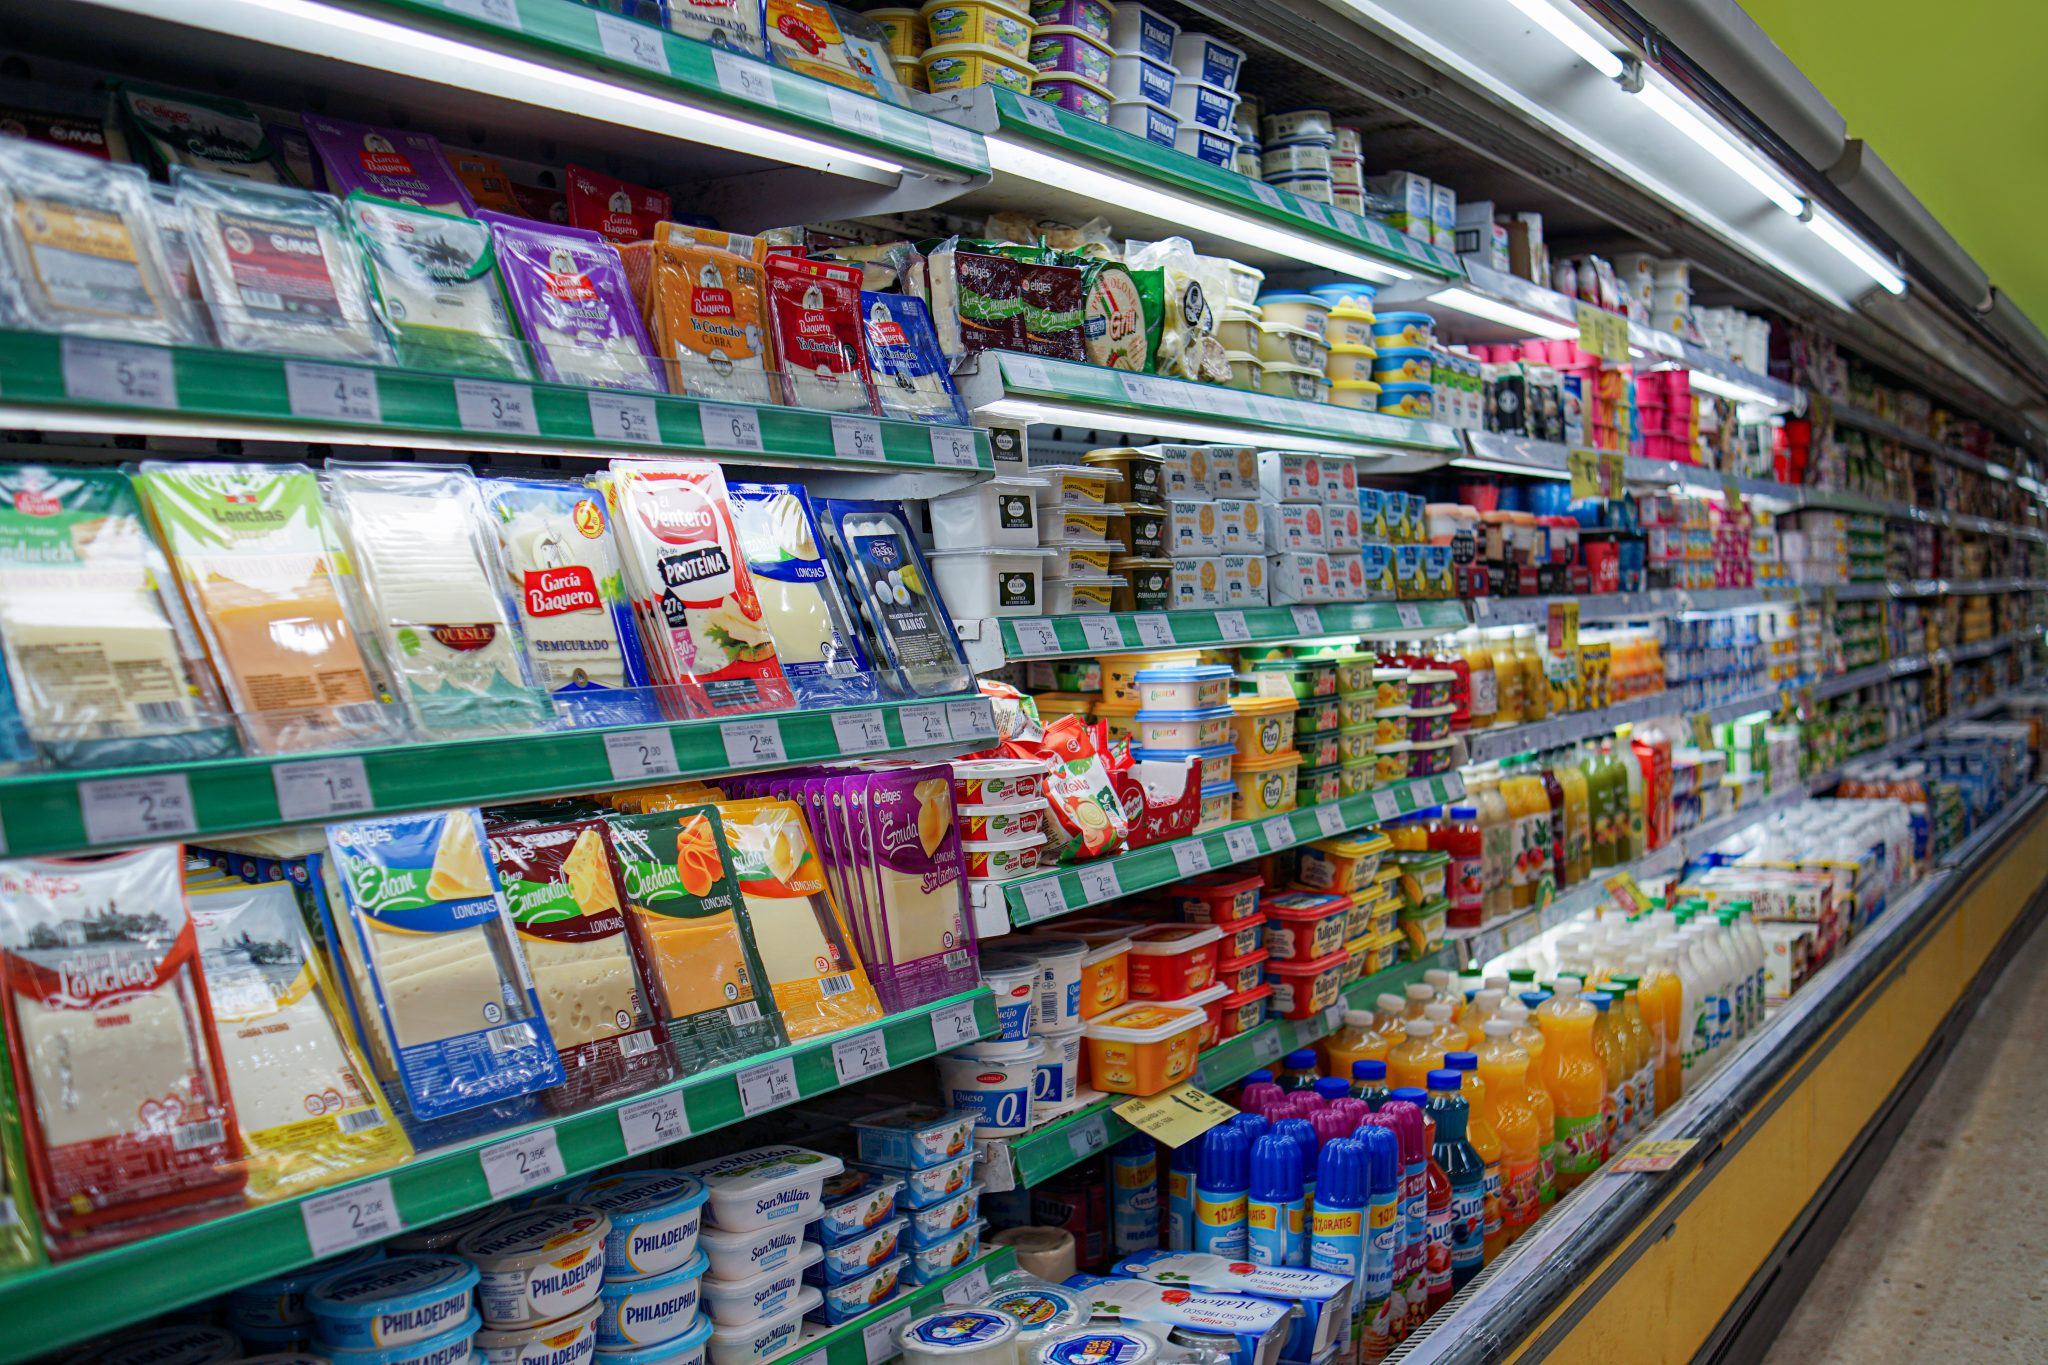
Store
Mix
SKUby store
01Explain & Alert
See what changed, and why.
- ◆ Variance bridge to drivers
- ◆ Source-record evidence
- ◆ Emerging-risk alerts on P&L and cash
02Budget & Forecast
Build plans from the business.
- ◆ Driver models: quantity × rate
- ◆ Rolling forecasts and scenarios
- ◆ Owners, approvals, versions
03Decide & Follow Through
Choose actions grounded in reality.
- ◆ Pricing, workforce, capacity, capital
- ◆ Within operating constraints
- ◆ Assigned and tracked to the P&L
01 · Explain & Alert
Follow a variance from the P&L to the shop floor
Interactive example
Volume: 52k kg × $17.04 = $886k ÷ $48.2M rev = 1.8 ptsResin: 812k kg × $0.96 = $780k ÷ $48.2M = 1.6 ptsPrice/mix offset +0.3 pts · net −3.1 pts
 Opti
What changed
Gross margin: 31.4% (−3.1 pts vs plan)
Why
Revenue beat plan by $1.3M, but margin fell 3.1 pts. Cost of goods outran volume.
What next
Go one level deeper to see what moved it.
03 · Decide
Price the decision before you take it.
Interactive example
Calculated · quarter · $M
Base gross profit$15.13M
Scenario gross profit$15.13M
Gross margin
31.4%
Δ Profit
±0.00
Δ Cash*
±0.00
*Cash assumes 45 days of working capital on the revenue change. Profit ≠ cash.
OptiWhat changed
Gross profit ±0.00M vs base; margin 31.4%.
Why
Volume spreads fixed cost; margin moves with absorption.
What next
Compare against a price action or a second supplier.
Built around your drivers
One planning platform, built around each industry's drivers
Manufacturing
Units · yield · input cost · capacity
Retail
Sales · price · mix · inventory
Upstream energy
Production · price · lifting cost
Power
Demand · generation · fuel · outages
Insurance
Premiums · claims · loss ratios
Banking
Balances · spreads · fees · credit cost
Conglomerates
Entities · capital · shared reporting
Start with one business. Prove the value.
Target: a working demo within two weeks once the required data and access are available.
Understand why
One material variance traced to its operational drivers and source records.
See what comes next
A driver-based forecast that shows emerging risks to P&L and cash.
Compare your options
A decision scenario: alternative actions within operating constraints.
- Day 0Scope agreedData & access ready
- Day 5Driver model connectedYour ledger, your drivers
- Day 14Working demoOn your data
Source traceability
Every explanation links to postings, mappings and periods.
Explicit assumptions
Assumptions are separated from calculated outputs.
Owners & approvals
Plans carry an owner, an approval and a version history.
Access control
Role-based access by entity and department.
Questions
Questions about OptiPlan and driver-based planning
- What is driver-based planning?
- It is planning from the operational quantities that move each P&L line, such as volume, rate, mix, yield, headcount and capacity, instead of from last year's totals. Change a driver and every line that depends on it updates.
- We plan in spreadsheets. Do we have to stop?
- No. OptiPlan reads your ledger and your current budget, and your team keeps its way of working while the drivers are mapped.
- What does "Let your P&L talk" mean?
- Each line of the P&L can say why it moved: which business unit, which account, which driver and which operation. The explanation links to the postings behind it.
- How do we see it on our own numbers?
- Through the CFO Challenge: bring one P&L question and your data, and OptiU returns a working demonstration.
Start with a scan.
You get a prioritized AI roadmap. Scope, timing and terms are agreed before any work starts.