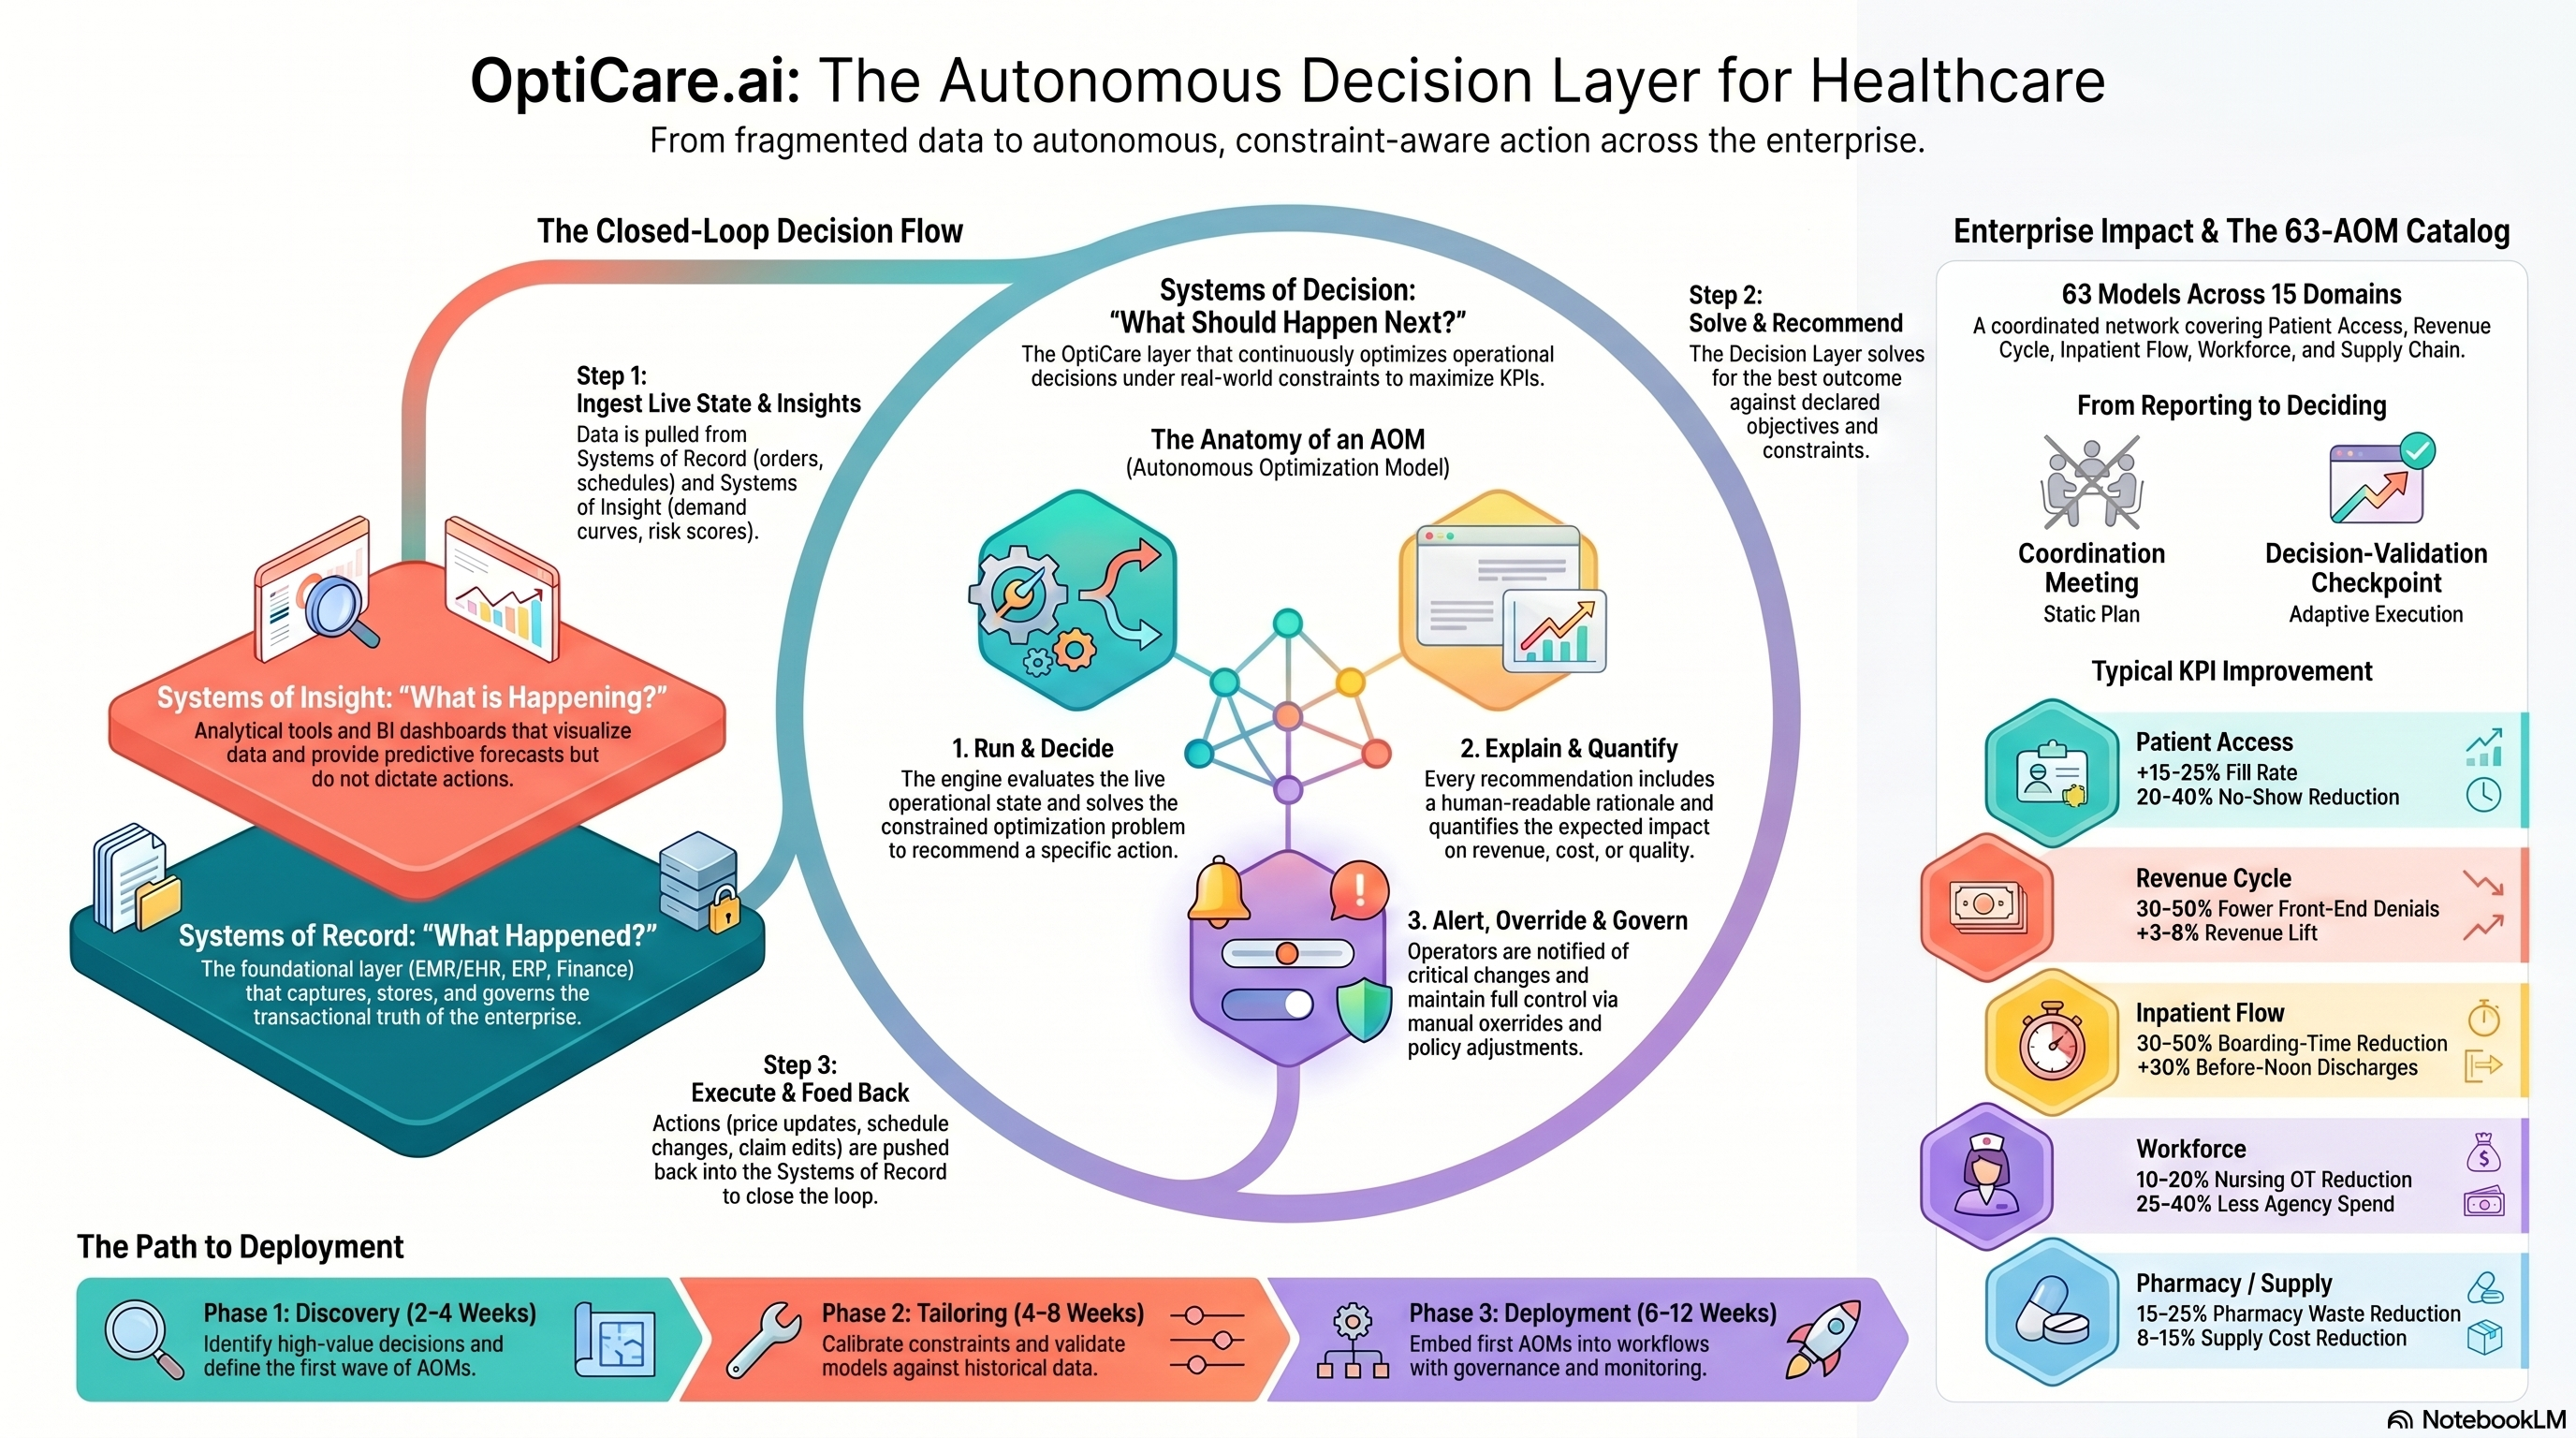
The optimization backbone for healthcare operations.
From boarding to bed assignment to denial appeals, AOMs decide the optimal next move across acute, ambulatory, and revenue-cycle operations — fully explainable, fully overridable.
- Boarding −30–50%
- OR utilization +10–20%
- Denials −30–50%
- LWBS −20–40%
Care Continuum + Revenue Cycle
Every cluster, one card at a time.
Page through all 15 OptiCare clusters and the AOMs inside each.
Access & Scheduling
Patient access, referral routing, and slot-fill optimizers.
Maximizes fill across providers under acuity and constraint rules.
Routes referrals to the best-fit provider/location balancing access and outcomes.
Predicts no-show risk and triggers right-sized overbooking.
Adjusts visit lengths to true case complexity.
Re-orders the queue to keep wait variance within target bands.
Take it with you.
Infographic is yours to download. The overview and deck go out after a quick form.
Run a careoptimizer, or tell Opti you're interested.
Looking for OptiU thesis content? Visit the parent site.
Start with a Diagnostic.
1–2 weeks. Top-10 AOM candidates. 12-month ROI roadmap. $10K–$50K.