OptiEnergy · 65 AOMs
The optimization backbone for upstream and downstream operations.
From well performance to crude blend, AOMs decide the optimal next move across upstream and refinery operations — closed-loop, constraint-bound, control-room ready.
- GRM uplift +5–10%
- Throughput +3–6%
- Downtime −20–40%
- Working Capital −10–25%
Value chain
Upstream Operations Flow
5 stages · 25 AOMs visible
Upstream operations — wells to pads to facility to OPI
Materials
Take it with you.
Infographic is yours to download. The overview and deck go out after a quick form.
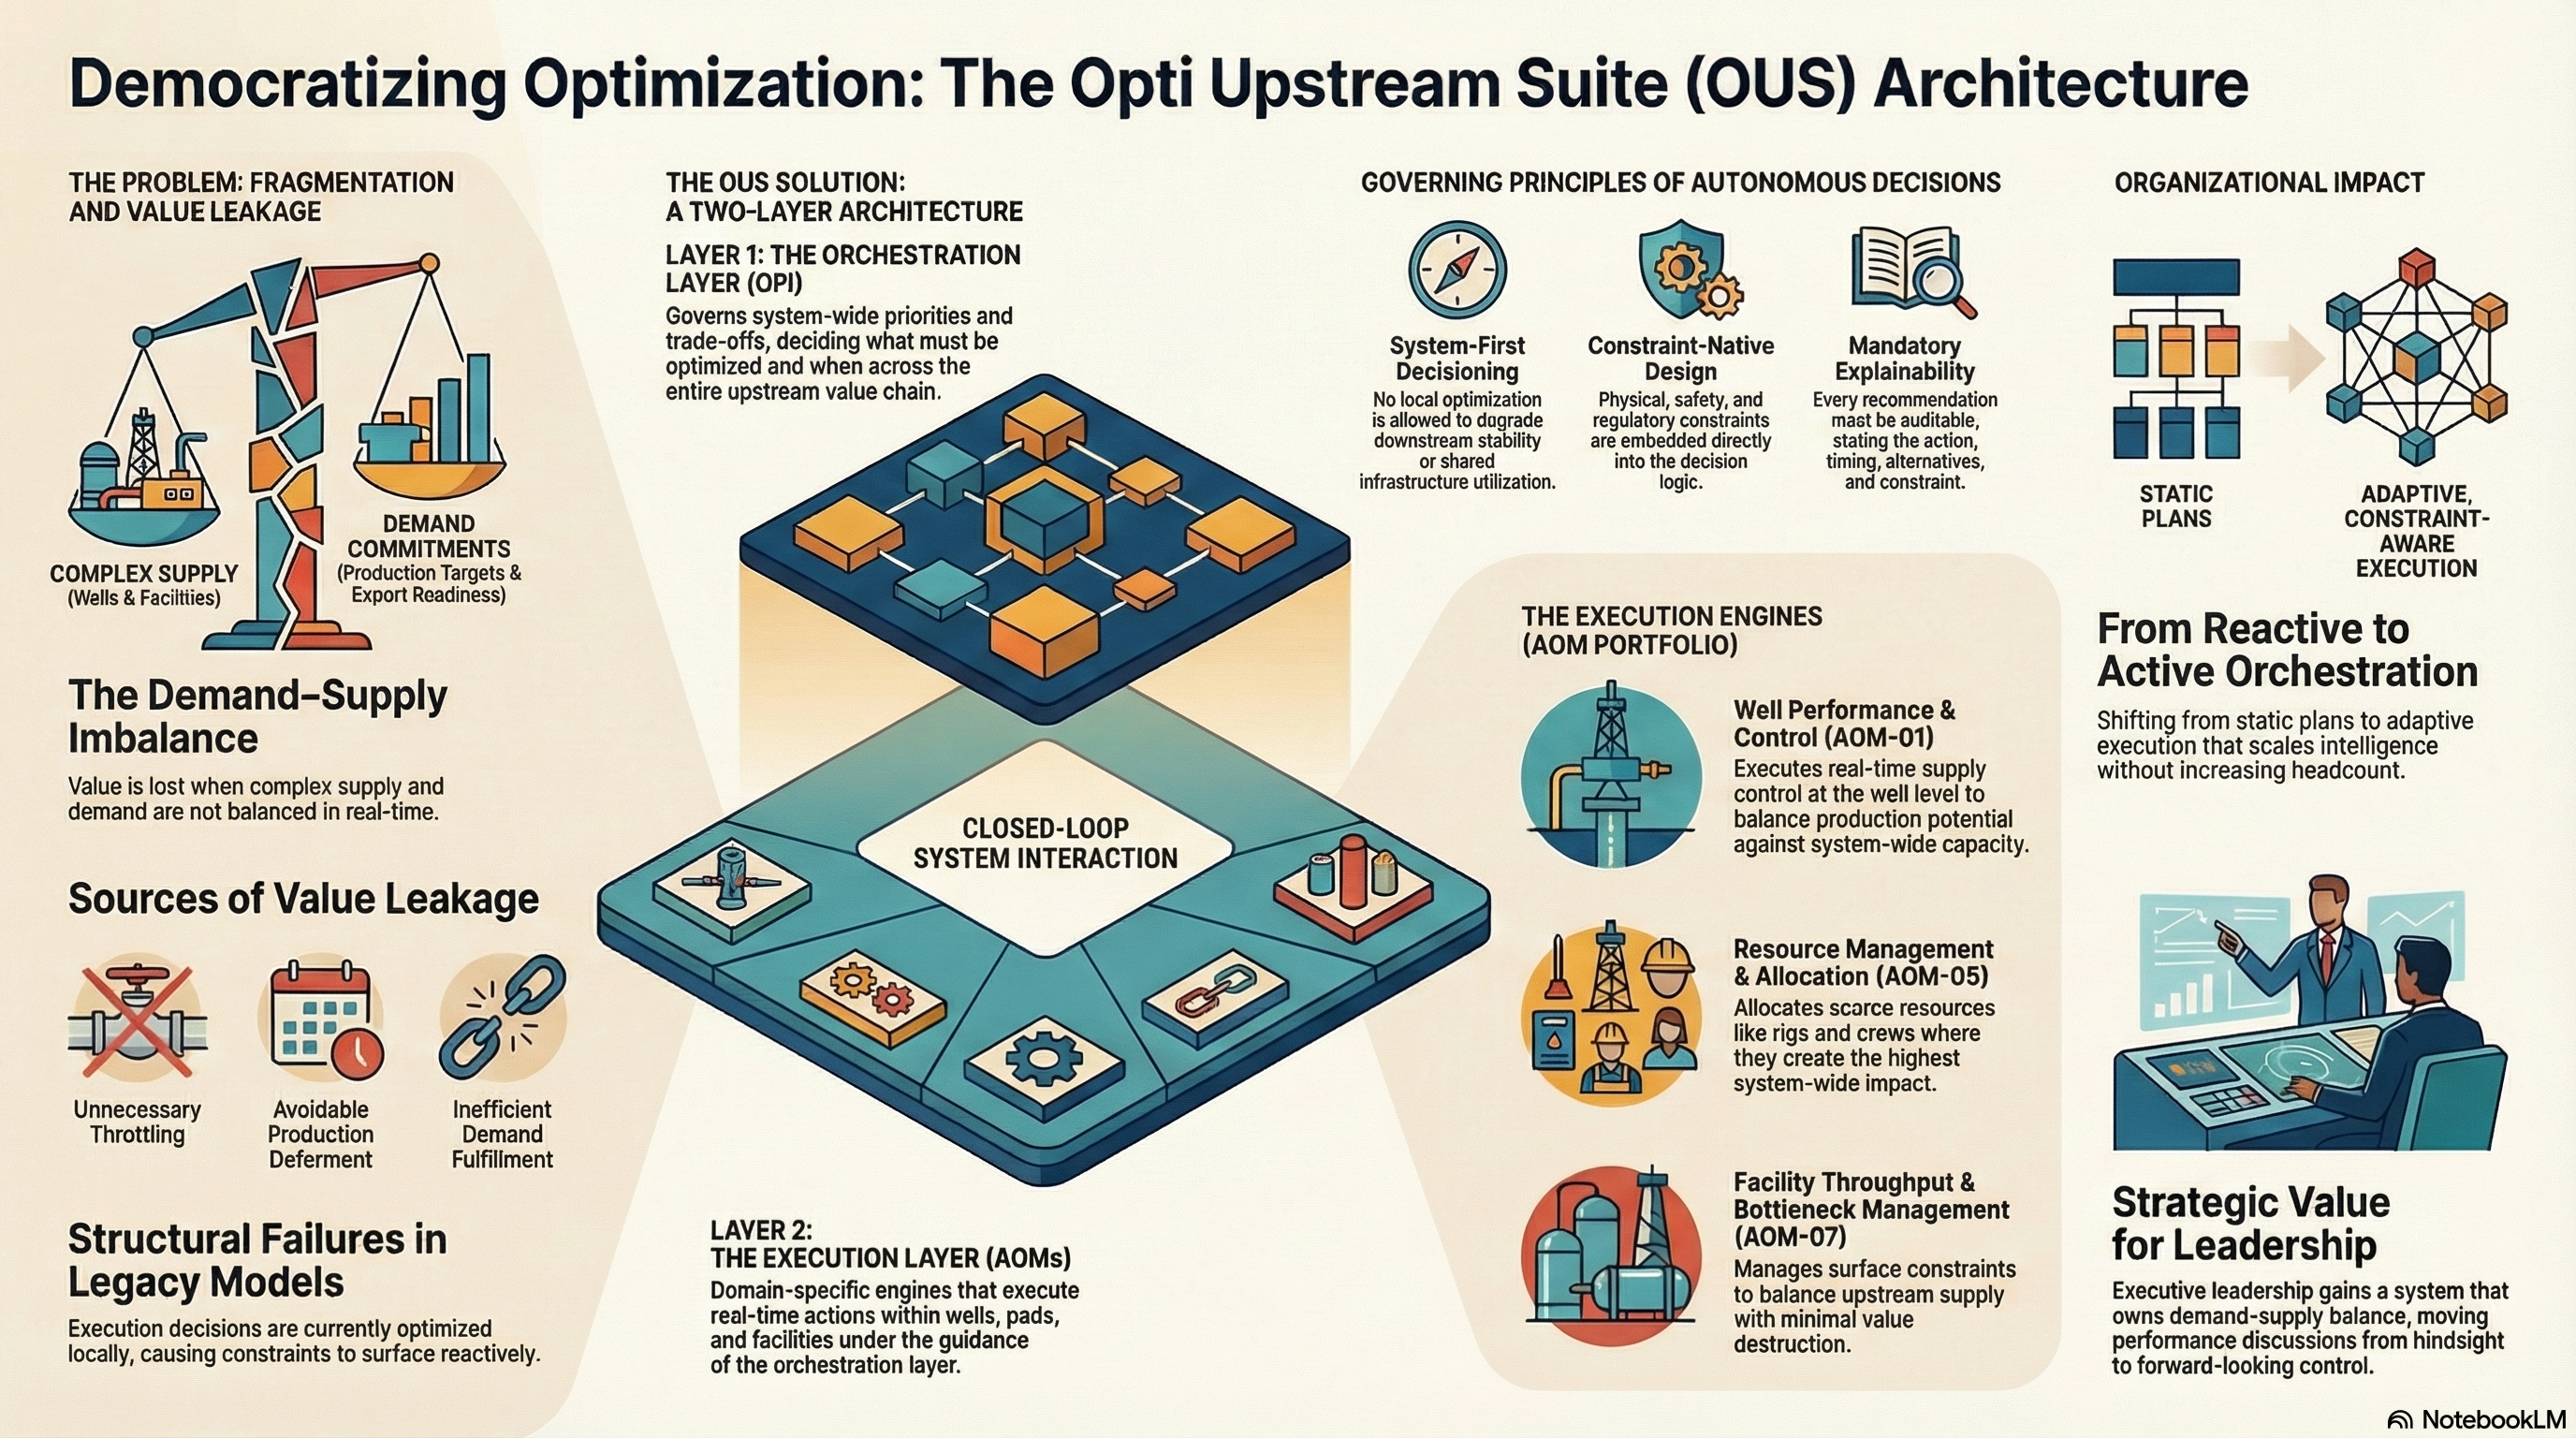
OptiUpstream
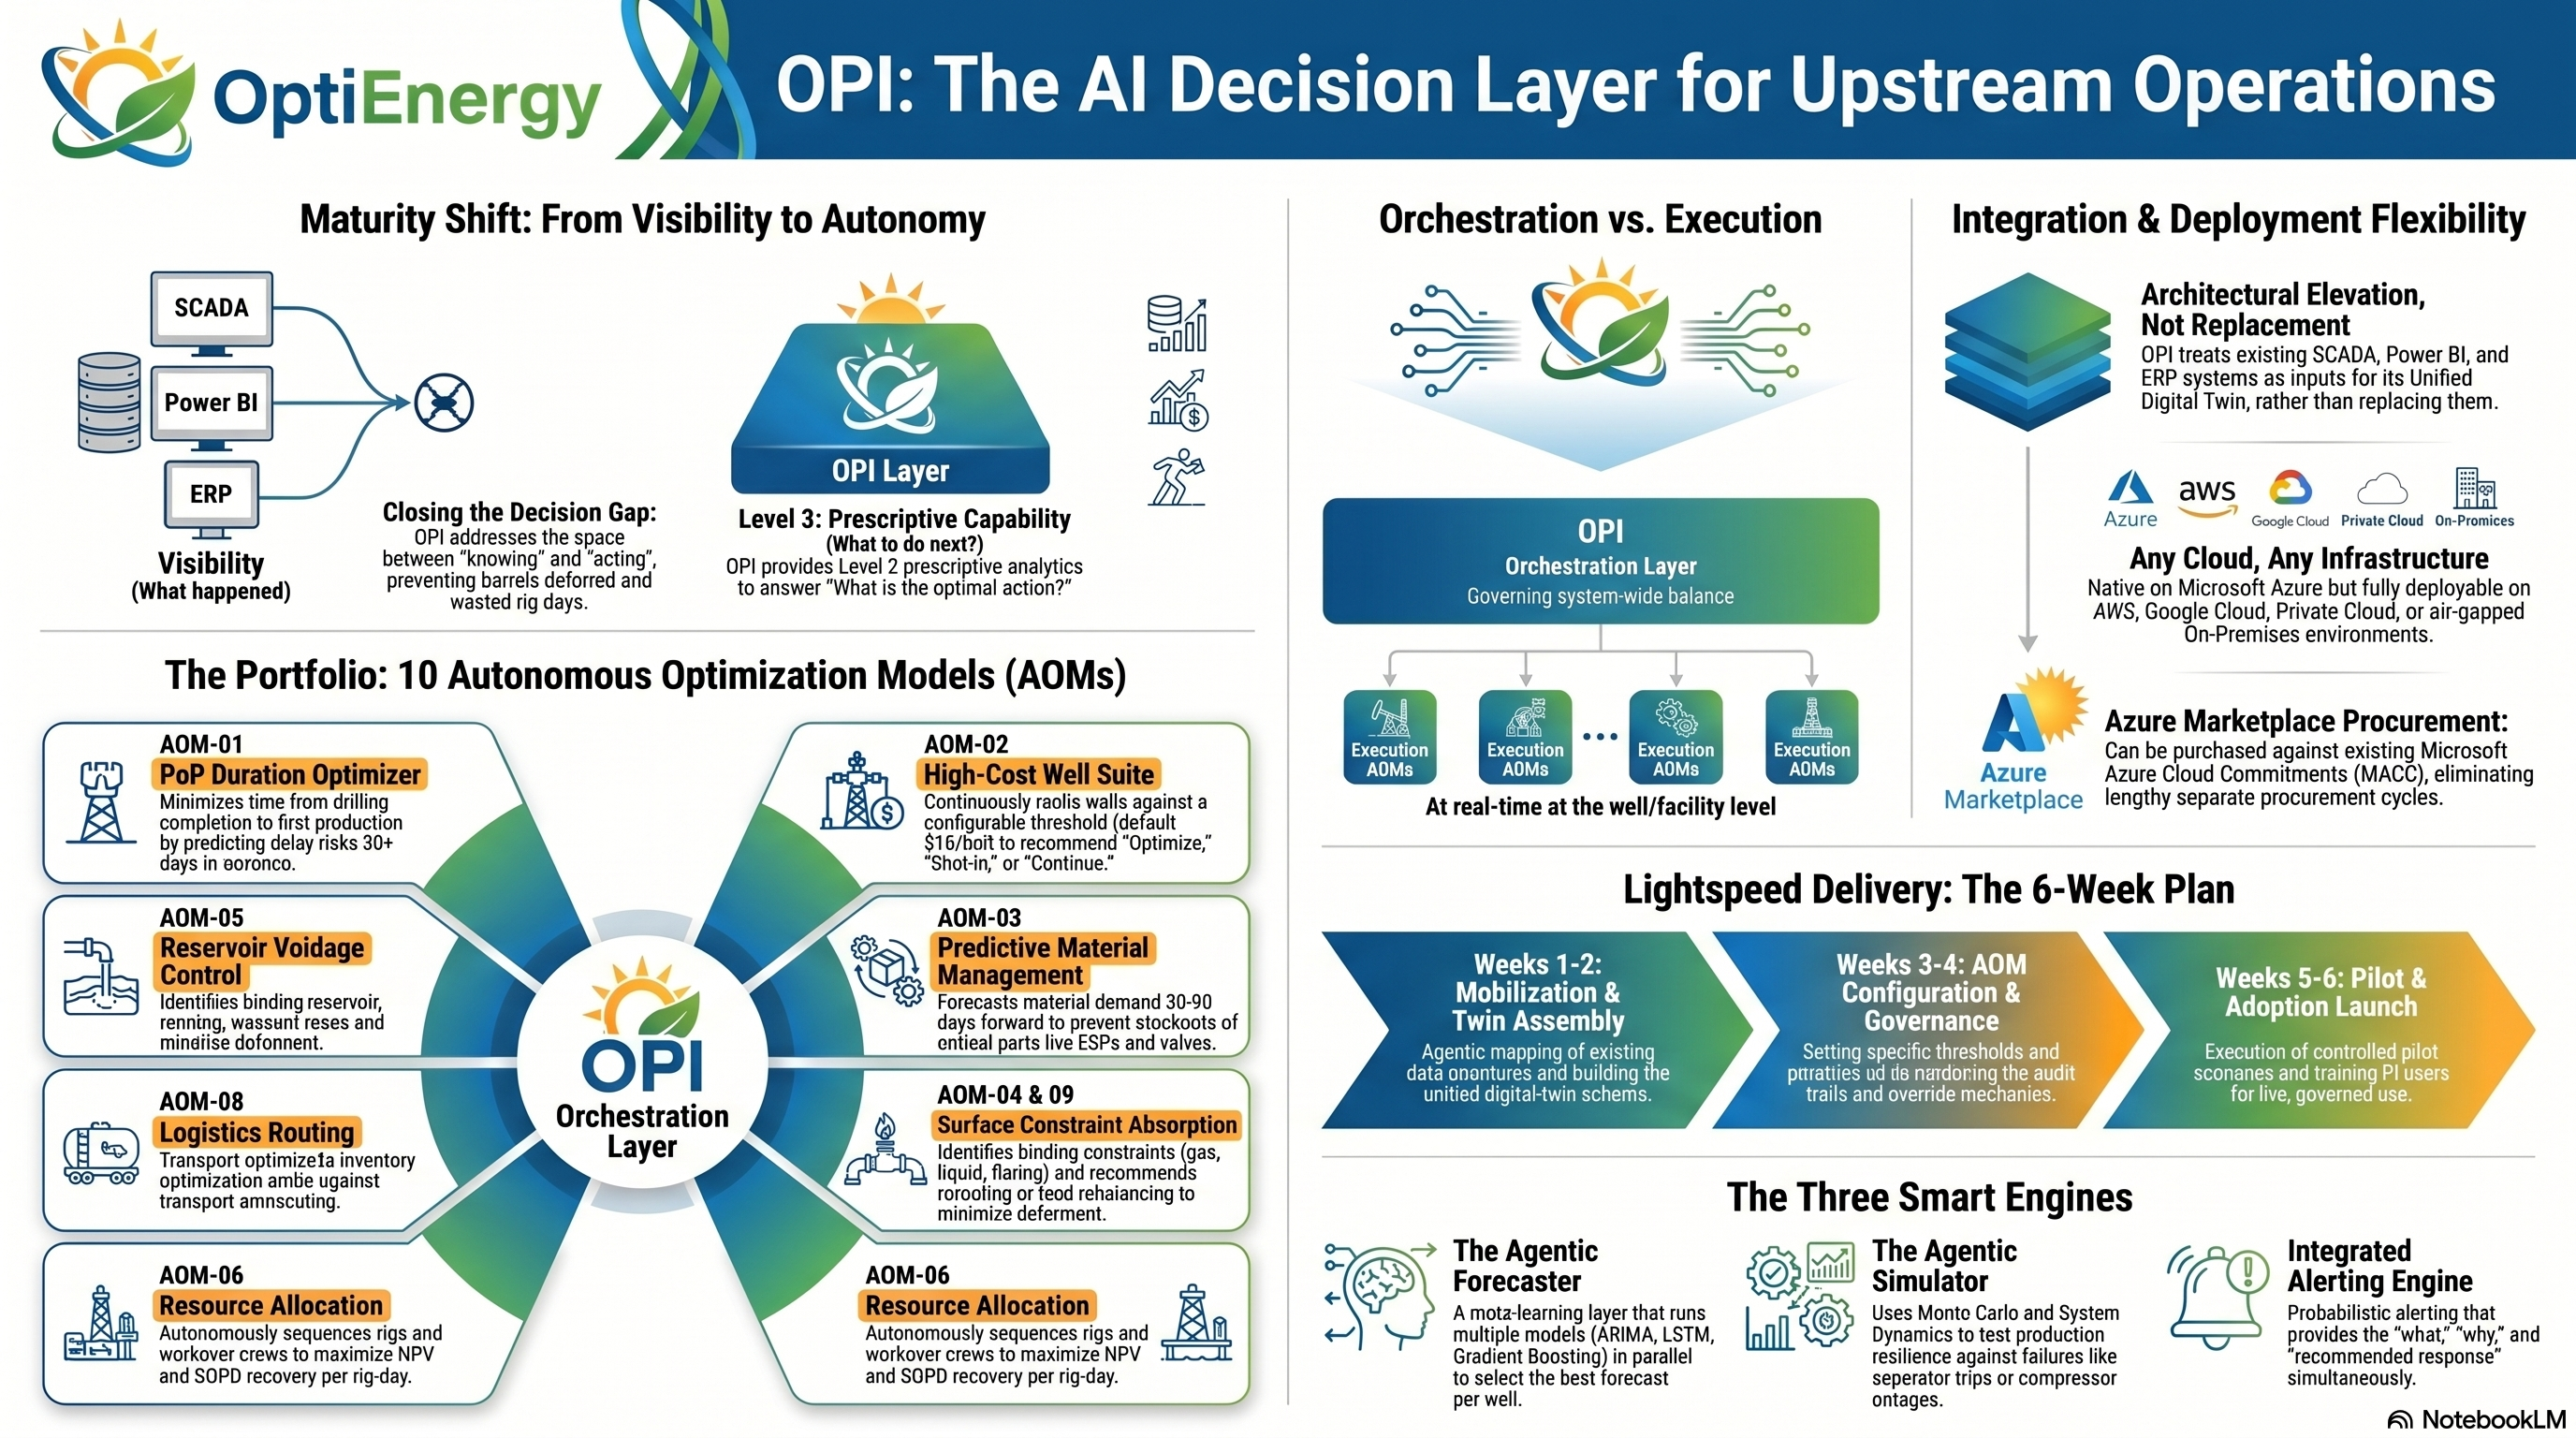
OptiUpstream OPI
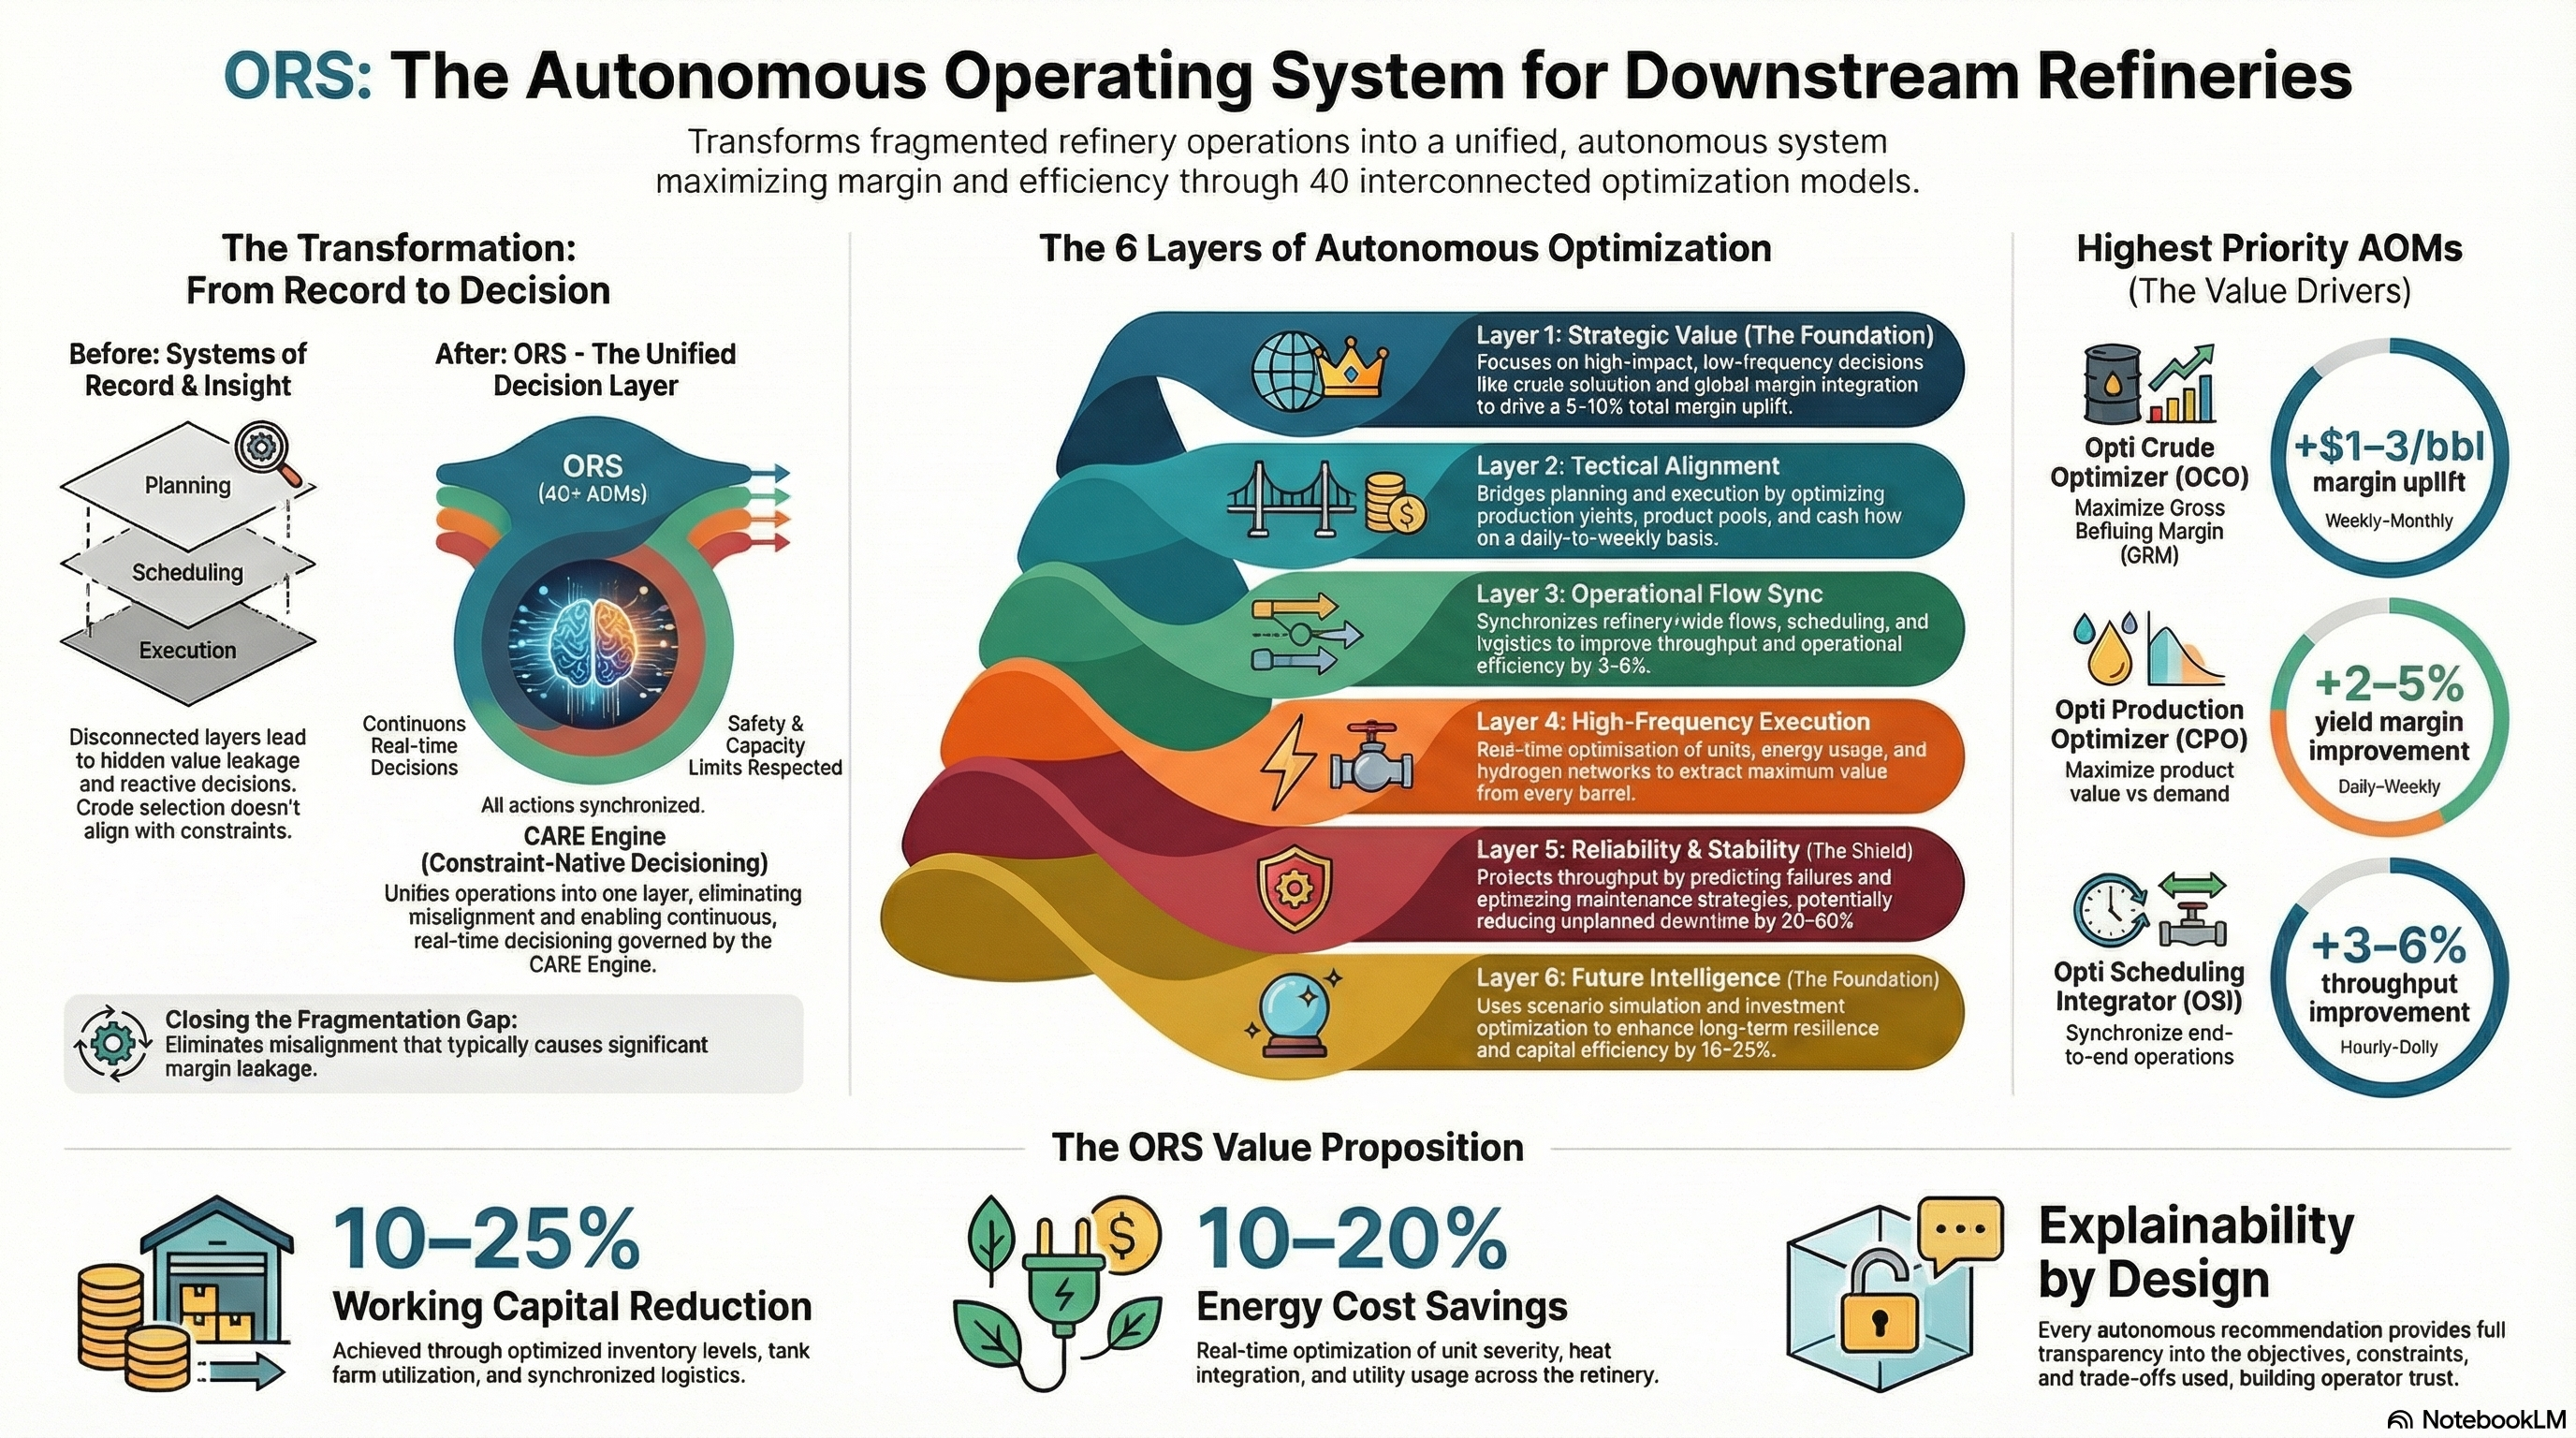
OptiRefinery
Get involved
Run a energyoptimizer, or tell Opti you're interested.
Looking for OptiU thesis content? Visit the parent site.
Not ready for a full deployment?
Start with a Diagnostic.
1–2 weeks. Top-10 AOM candidates. 12-month ROI roadmap. $10K–$50K.